Decided to get ChatGPT to do some analysis from this FOI request
Few interesting tid bits
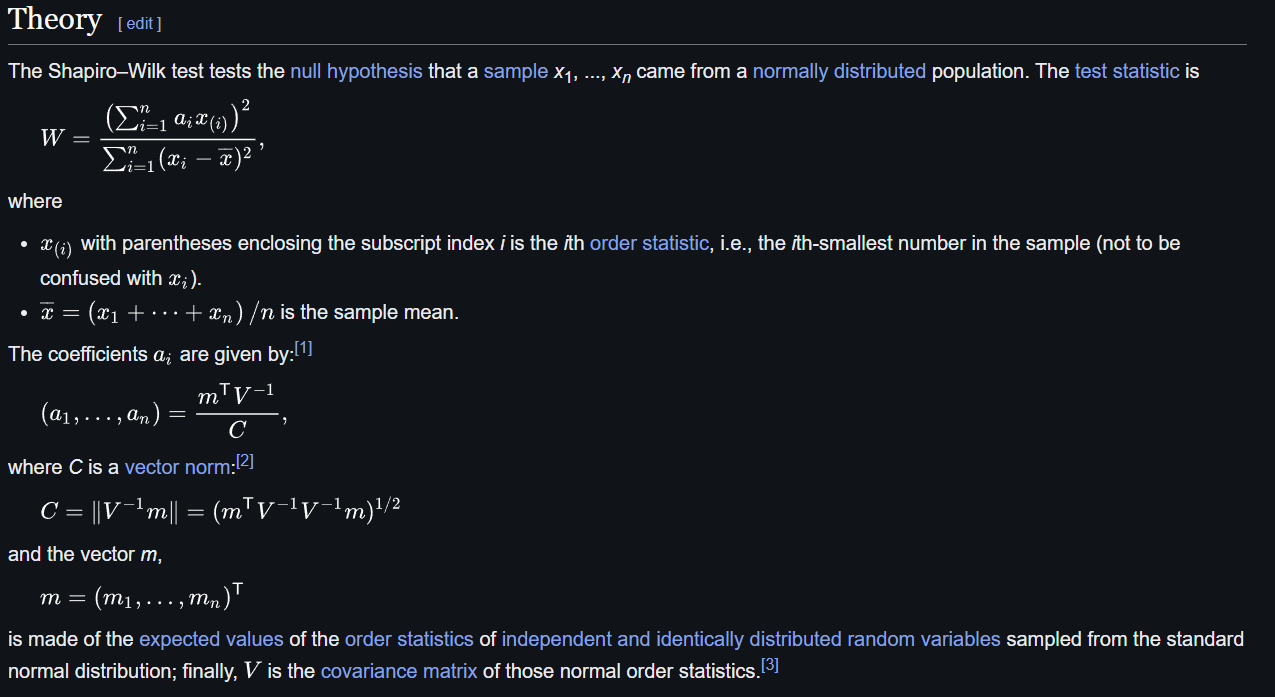
It really annoyed me how They don’t follow a Normal Distribution so I got a table
The cadet Rank distribution is as would be expected
(ChatGPT failed the maths on London wing not me)
Shockingly no outliers for Flt Lt or WO
Basically what this waffle is leading to is why do some areas of the UK have Such high Average ages for Junior Uniformed Ranks? Are these areas struggling to get younger staff, hence the wing average being dragged up?
Any insight or ideas would be great!
(also all the boring Calculation data, and parameters are available, just thought this post was long/boring enough)
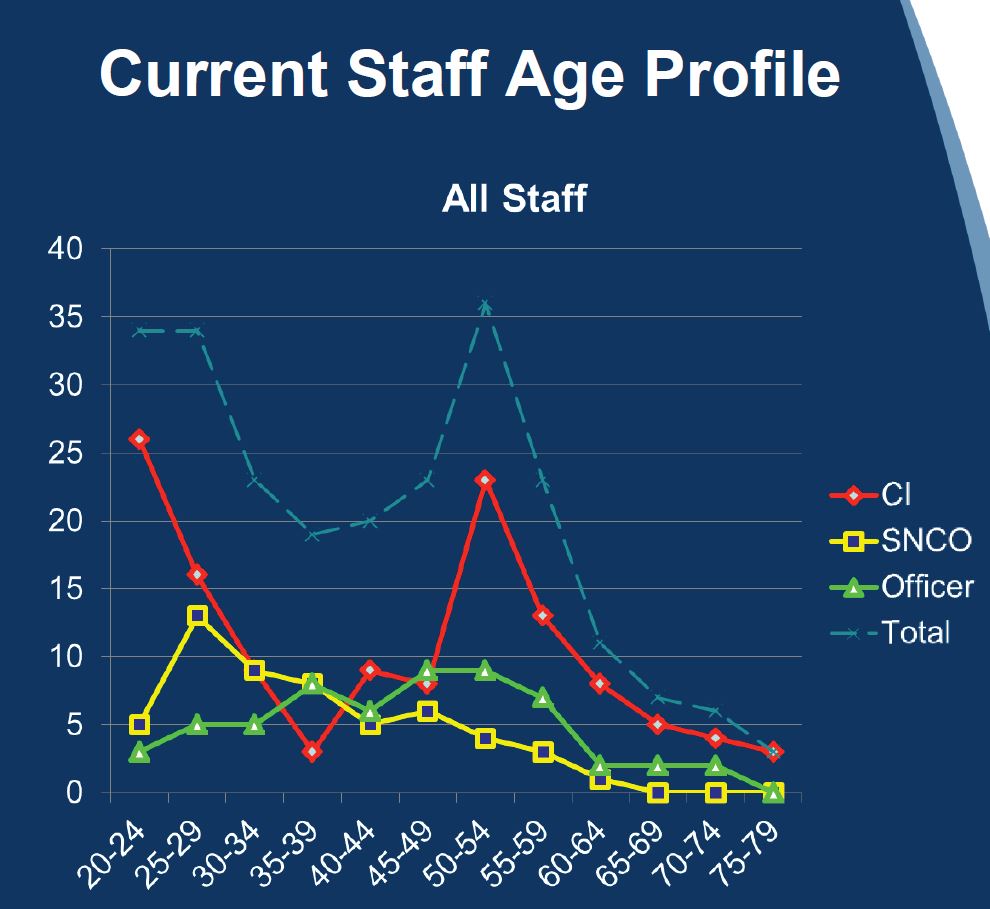
based on data i remember Wing sharing many moons ago, staff ages is not a normally distributed data set across all the ranks.
many join in their 20s, mostly ex Cadets directly or soon after Uni or other distractions.
then they stick around for ~10 years, then end up married, with kid(s) which are a priority and so sees people leave. some of those return ~10 years later as their kid shows an interest and so they reengage - or for those without prior CFAV experience is the time they first get involved when their kid shows interest
I have found that graph and none of the lines, be it separated by flavour of commitment or overall shows “normal” distribution based on age - this date is almost 10 years old so not current, and won’t take into account and post Covid19 effect but offers some real numbers…